In the previous post I explained what is the difference between Icinga active and passive checks, why can be interesting to use passive checks, what is the result format Icinga is expecting when processing those checks and the way I use to send those results (instead of using snmp traps).
Now it is time to show how to configure it and examples
Enable passive checks
Enable the command feature by running…
icinga2 feature enable command… and dont forget to restart
service icinga2 restartNow it can be checked that the external command file has been created:
# ls /var/run/icinga2/cmd/icinga2.cmd -l
prw-rw---- 1 nagios www-data 0 Nov 24 09:13 /var/run/icinga2/cmd/icinga2.cmd
I remind you that the external command file is where the passive check results strings should be placed to allow Icinga process them.
Create a passive check
Configure a template (/etc/icinga2/conf.d/templates.conf)…
template Service "passive-service" {
  import "generic-service"
  check_command = "passive"
  enable_active_checks = false
  enable_passive_checks = true
  check_interval = 2m
}
(Visit this post Understanding checks and notification types for more details)
… and a service that uses the template (/etc/icinga2/conf.d/services.conf)
apply Service "TEST service" {
  import "passive-service"
  assign where host.name == "TEST-SERVER"
}
(of course, SERVER1 should be an already configured host)
Reload your icinga server to apply the changes so you can see the recently created service:

Now, as we saw in the previous post, this is the format in which the service results should be sent:
[<timestamp>] PROCESS_SERVICE_CHECK_RESULT;<host_name>;<svc_description>;<return_code>;<plugin_output>
So, as a test, lets try sending results manually to the external command file. For example, this should set the service in “OK” state:
# echo "[`date +%s`] PROCESS_SERVICE_CHECK_RESULT;TEST-SERVER;TEST service;0;OK result sent manually" >> /var/run/icinga2/cmd/icinga2.cmd
Some seconds after running the command…

For “WARNING” state:
# echo "[`date +%s`] PROCESS_SERVICE_CHECK_RESULT;TEST-SERVER;TEST service;1;WARNING result sent manually" >> /var/run/icinga2/cmd/icinga2.cmd

Finally, “CRITICAL” state:
# echo "[`date +%s`] PROCESS_SERVICE_CHECK_RESULT;TEST-SERVER;TEST service;2;Uffff CRITICAL result sent manually" >> /var/run/icinga2/cmd/icinga2.cmd

Ok, it’s working. But this seems not to be very useful because we are sending the results from the icinga server itself. But the goal is to send results collected in a external system. To allow that, we need toto…
Configure tcp listener daemon
This daemon will be listening in certain port of the Icinga server waiting to receive results that will redirect to the external command file.
Install tcpserver utility
I have used “tcpserver”. It listens for incoming TCP connections and runs a program in response to a connection. In debian you can install it comes with the package ucspi-tcp
# apt-get install icspi-tcp
Create script to redirect incoming results
The idea is, for each connection, redirecting the data sent to the external command file. So let’s create the script that we will associate with the listener (for example, /usr/scripts/remote-command.sh) :
#!/bin/bash

read MESSAGE
echo $MESSAGE >> /var/run/icinga2/cmd/icinga2.cmd
Configure tcpserver daemon to be run at startup
Now this script has been created, it can be used with the tcpserver utility this way:
nohup tcpserver -q -H -R 0.0.0.0 <PORT> <SCRIPT> &> /dev/null &

nohup tcpserver -q -H -R 0.0.0.0 3334 /usr/scripts/remote-commands.sh &> /dev/null &
(nohup and the ending & is to launch it in background). After running the command, you can use a simple telnet or netcat to connect to the port (i have chosen 3334, but you use any port you want), and all you write will be redirected to the external command file because is processed by the script.
But, you want the tcpserver daemon to be launched automatically when you init the system, so lets create the /etc/init.d/remote-commands-daemon.sh script:
#!/bin/bash

### BEGIN INIT INFO
# Provides:       remote-commands-daemon
# Default-Start:     2 3 4 5
# Default-Stop:      0 1 6
# Short-Description: service to receive icinga remote external commands
### END INIT INFO
LOCK_FILE="/var/lock/remote-commands-daemon"

case "$1" in
  start)
    if [ -f $LOCK_FILE ]
    then
        echo "Service already running..."
    else
        echo "Starting service remote-commands "
        nohup tcpserver -q -H -R 0.0.0.0 3334 /usr/scripts/remote-commands.sh &>/dev/null &
        touch $LOCK_FILE
    fi
    ;;
  stop)
    if [ ! -f $LOCK_FILE ]
    then
        echo "Service is not running..."
    else
        echo "Stopping service remote-commands"
        killall -9 tcpserver
        rm $LOCK_FILE
    fi
    ;;
  *)
    echo "Usage: /etc/init.d/remote-command-daemon {start|stop}"
    exit 1
    ;;
esac

exit 0
And create the related symlinks:
# update-rc.d remote-commands-daemon.sh defaultsFrom now, when booting up the system the daemon will be automatically started.
Or you can manually start/stop it:
# /etc/init.d/remote-commands-daemon.sh <start | stop>Script that checks and sends results remotely
Now the icinga server is listening in the configured port for incoming check result strings, lets suppose we want monitor the number of processes a system is running.
This powershell example could be used in a windows system:
$ICINGA_SERVER="10.0.1.50"
$ICINGA_PORT="3334"

$CRITICAL_LIMIT=300
$WARNING_LIMIT=200

$DATETIMESTAMP = (Get-Date).ToUniversalTime()
$DATETIMESTAMP = Get-Date($DATETIMESTAMP)  -UFormat %s
$DATETIMESTAMP = "[{0:G}]" -f [int][double]::Parse($DATETIMESTAMP)

$RESULT = (Get-Process | Measure).Count

if ($RESULT -gt $CRITICAL_LIMIT)
{
    $MSGTMP = " PROCESS_SERVICE_CHECK_RESULT;TEST-SERVER;Test service;2;There are $RESULT processes running"
}
else
{
    if ($RESULT -gt $WARNING_LIMIT)
    {
        $MSGTMP = " PROCESS_SERVICE_CHECK_RESULT;TEST-SERVER;Test service;1;There are $RESULT processes running"
    }
    else
    {
        $MSGTMP = " PROCESS_SERVICE_CHECK_RESULT;TEST-SERVER;TEST service;0;There are $RESULT processes running"
    }
}

$MSG = $DATETIMESTAMP + $MSGTMP

$MSG | .\ncexe $ICINGA_SERVER $ICINGA_PORT
Note that the timestamp is calculated because it is needed to be included in the result string.
To send string via TCP/IP i use the windows version of the netcat tool by piping the result string to it.

Schedule the execution of this script (the configuration is not in the scope of this post) so you can keep the service monitored.
Raise alert if no results are being sent
Icinga can be configured to raise an alert If for any reason the external system is not sending the monitoring results (visit this post Understanding checks and notification types for more details).
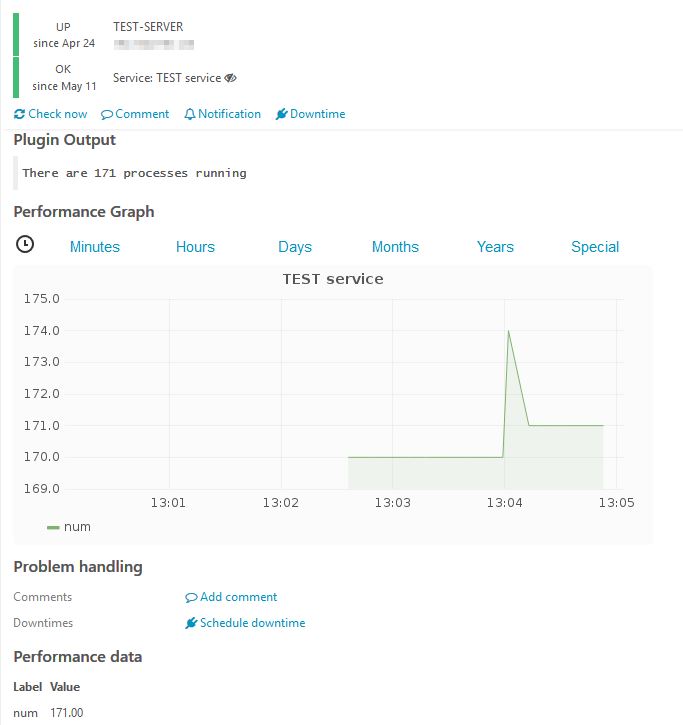
Send performance data
If you are generating graphs of the active services, you can also generate of the passive ones the same way. Simply add the performance data in your monitoring script.
[<timestamp>] PROCESS_SERVICE_CHECK_RESULT;<host_name>;<svc_description>;<return_code>;<plugin_output>|<metric>=<value>;;;
For example, in the previous script:
... if ($RESULT -gt 300) { $MSGTMP = " PROCESS_SERVICE_CHECK_RESULT;TEST-SERVER;Test service;2;There are $RESULT processes running|num=$RESULT;;;"} else { if ($RESULT -gt 200) { $MSGTMP = " PROCESS_SERVICE_CHECK_RESULT;TEST-SERVER;Test service;1;There are $RESULT processes running|num=$RESULT;;;" } else { $MSGTMP = " PROCESS_SERVICE_CHECK_RESULT;TEST-SERVER;TEST service;0;There are $RESULT processes running|num=$RESULT;;;" } ...
All the configurations explained in this post are not as hard as it appears to be, and once you have done it for the first passive service the following are very fast to create. 🙂