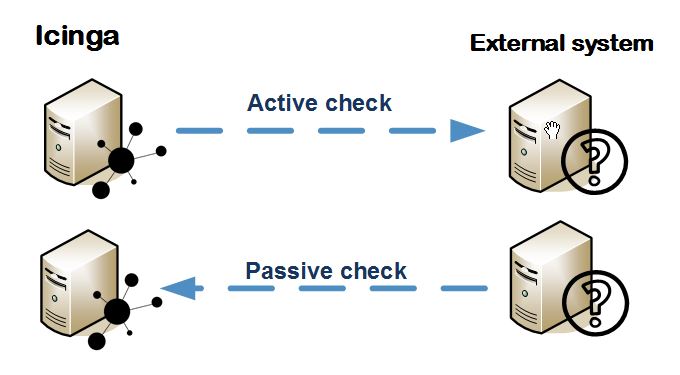
As I posted long time ago for Nagios (Nagios – Using passive checks without agent), it is time to show an easy way to configure Icinga to perform passive checks (without using SNMP traps).
This is the first of two posts. In this I only want to make some theoretical explanations and then in the second I will go deeper into the technical aspect and needed configurations.
Active checks vs Passive checks
Unlike active checks (which are those checks initiated and performed by the Icinga system), the passive checks are performed by external applications and the results are sent to the Icinga for processing.

Why do I need passive checks?
In some cases, there are checks that need to be sent only eventually (for example, a hardware failure of a fan or power supply) so that check can be delegated to the external system to make a notification when a problem arises.
Another reason is because the external system is behind a firewall that blocks connections needed for the active checks.
But I use them for another reason. The active checks are performed by the Icinga system. I have the Icinga running under my Debian Linux, so I can only perform checks with scripts or plugins Linux compatible (like bash, snmp protocol, SSH, etc…). And I cannot check anything I want against, for example, Windows systems or many of the multiple system types I want to monitor.
The use of passive checks allows to delegate the check to the external system itself. So, for example, in windows I can use any method (for example, I have used powershell for many of them…) to perform the check I need as long as, afterwards I send the results to Icinga.
Which result format is Icinga expecting?
Icinga checks periodically its local external command file located in /var/run/icinga2/cmd/icinga2.cmd in which it expects to find the passive checks results in the following format (from Submitting Passive Service Check Results):
[<timestamp>] PROCESS_SERVICE_CHECK_RESULT;<host_name>;<svc_description>;<return_code>;<plugin_output>
where…
- timestamp is the time in time_t format (seconds since the UNIX epoch) that the service check was perfomed (or submitted). Please note the single space after the right bracket.
- host_name is the short name of the host associated with the service in the service definition
- svc_description is the description of the service as specified in the service definition
- return_code is the return code of the check (0=OK, 1=WARNING, 2=CRITICAL, 3=UNKNOWN)
- plugin_output is the text output of the service check (i.e. the plugin output)
So, simply by adding a text line to the external command file the result is processed. But the following question is…
How can the results be sent to Icinga remotelly by the external system?
In other words, how can the monitored external system send the passive check result to be written in the external command file?
Icinga documentation shows the way to use SNMP traps (Official doc: Passive Check Results and SNMP Traps), but I prefer to use a more easy way:
Using a tcplistener daemon simplifies the way to the send text via TCP:
- In the Icinga side, the tcplistener daemon waits for connections in certain port of our choice (for example 3334). The daemon is configured to write the received data to the external command file.
- In the monitored external system side, the program/script that checks the service is programmed to connect to the icinga configured tcplistener port and send the result string in the expected format that was explained before.

Ok, ok… but how I configure it?
If you give me a little time to prepare the next post, I will show you the technical part of this topic:
- Configure a service in Icinga as passive check
- Install and configure the tcp listener daemon
- Example script that sends the passive checks results
🙂
