I usually use remote active checks by executing SNMP queries or SSH commands. But there are systems and values that cannot be monitored this way.
The passive checks have allowed me to check anything that I cannot check remotely via SNMP or SSH. But I did not want any agent (NSC++, NPA…) installed on the monitored system. That problem can also be avoided.
Contents
- 1 Enable passive checks in Nagios
- 2 Passive check results format and procedure
- 3 Configure service to receive passive checks results
- 4 Configuring script to send passive checks results on the monitored host
- 4.1 Analyze the status of our target
- 4.2 Generate the passive check message
- 4.3 Send the passive check result to the Nagios server
Enable passive checks in Nagios
From the official doc:
In order to enable passive checks in Nagios, you'll need to do the following:
- Set accept_passive_service_checks directive to 1.
- Set the passive_checks_enabled directive in your host and service definitions to 1.
If you want to disable processing of passive checks on a global basis, set the accept_passive_service_checks directive to 0.
If you would like to disable passive checks for just a few hosts or services, use the passive_checks_enabled directive in the host and/or service definitions to do so.
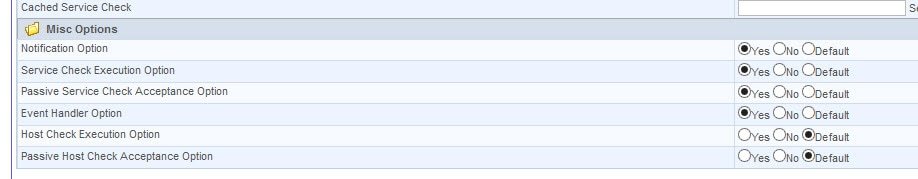
Or if you use Centreon like me:
Configuration / Nagios / nagios.cfg / Checks options
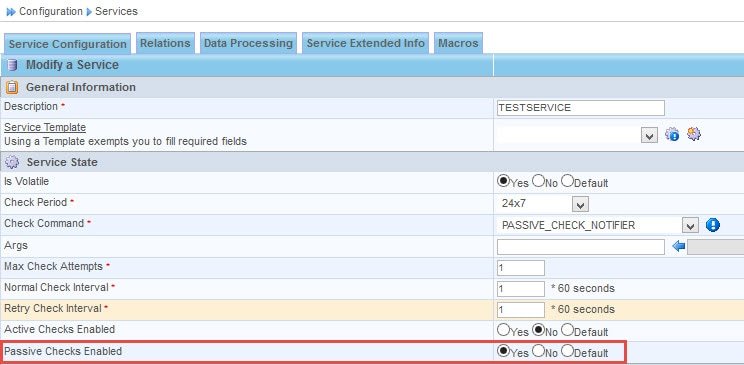
And in the host/service definition:
Passive check results format and procedure
Again from the official doc:
External applications can submit passive service check results to Nagios by writing a PROCESS_SERVICE_CHECK_RESULT external command to the external command file.
The format of the command is as follows:
[] PROCESS_SERVICE_CHECK_RESULT;<host_name>;<svc_description>;<return_code>;<plugin_output>
where…
- timestamp is the time in time_t format (seconds since the UNIX epoch) that the service check was perfomed (or submitted). Please note the single space after the right bracket.
- host_name is the short name of the host associated with the service in the service definition
- svc_description is the description of the service as specified in the service definition
- return_code is the return code of the check (0=OK, 1=WARNING, 2=CRITICAL, 3=UNKNOWN)
- plugin_output is the text output of the service check (i.e. the plugin output)
In my Centreon Nagios, the external is /var/lib/nagios3/rw/nagios.cmd. So, to send PROCESS_SERVICE_CHECK_RESULT command manually to my TESTSERVICE service:
# echo "[`date +%s`] PROCESS_SERVICE_CHECK_RESULT;TESTHOST;TESTSERVICE;1;This is my warning message" >> /var/lib/nagios3/rw/nagios.cmd
# echo "[`date +%s`] PROCESS_SERVICE_CHECK_RESULT;TESTHOST;TESTSERVICE;2;This is my critical message" >> /var/lib/nagios3/rw/nagios.cmd
# echo "[`date +%s`] PROCESS_SERVICE_CHECK_RESULT;TESTHOST;TESTSERVICE;3;This is my unknown message" >> /var/lib/nagios3/rw/nagios.cmd
# echo "[`date +%s`] PROCESS_SERVICE_CHECK_RESULT;TESTHOST;TESTSERVICE;0;This is my OK message" >> /var/lib/nagios3/rw/nagios.cmd
Ok, we have performed a passive check by writing to the external command file. And we have been able to do it because we are executing the command locally on the Nagios host. But our target is sending passive checks results remotely!
Configure service to receive passive checks results
One of the simplest ways to achieve this is explained in my previous post (Linux – Create custom inetd service).
That newly configured service could use this simple script:
#!/bin/bash

read MESSAGE
echo $MESSAGE >> /var/lib/nagios3/rw/nagios.cmd
If you have followed the steps explained on that previous post, now you should be able to send passive checks results remotely.
Configuring script to send passive checks results on the monitored host
Now, sending a message over a TCP connection is an easy task using any scripting or programming language.
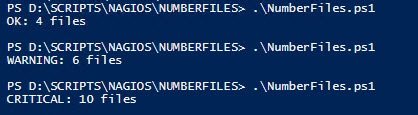
For example, using Powershell I am going to configure a useless scripts that monitors the number of files in a folder.
- Less than 5 = OK.
- Between 5 and 8 = Warning
- More than 8 = Critical
Analyze the status of our target
A section of the script will analyze the status of the parameters, services or targets of the monitored host:
$FOLDER = Get-ChildItem ("D:\SCRIPTS\NAGIOS\NUMBERFILES\MONITOREDFOLDER")
$NUM = $FOLDER.Count

If ($NUM -lt 5)
{
    Write-Host "OK: $NUM files"
}
ElseIf ($NUM -gt 8)
{
    Write-Host "CRITICAL: $NUM files"
}
Else
{
    Write-Host "WARNING: $NUM files"
}
Generate the passive check message
$FOLDER = Get-ChildItem ("D:\SCRIPTS\NAGIOS\NUMBERFILES\MONITOREDFOLDER")
$NUM = $FOLDER.Count

$DATETIMESTAMP = "{0:G}" -f [int][double]::Parse((Get-Date -UFormat %s))

If ($NUM -lt 5)
{
    Write-Host "[$DATETIMESTAMP] PROCESS_SERVICE_CHECK_RESULT;SERVER1;NUMFILES;0;OK: $NUM files"
}
ElseIf ($NUM -gt 8)
{
    Write-Host "[$DATETIMESTAMP] PROCESS_SERVICE_CHECK_RESULT;SERVER1;NUMFILES;2;CRITICAL: $NUM files"
}
Else
{
    Write-Host "[$DATETIMESTAMP] PROCESS_SERVICE_CHECK_RESULT;SERVER1;NUMFILES;1;WARNING: $NUM files"
}
Note the sentence used to generate the timestamp
Send the passive check result to the Nagios server
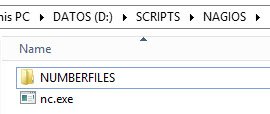
To send the result we can use the netcat tool simply copying it in a folder to refer to it on the script.
Supposing we configured the service that receives the passive checks results for example on the 3333 port:
$FOLDER = Get-ChildItem ("D:\SCRIPTS\NAGIOS\NUMBERFILES\MONITOREDFOLDER")
$NUM = $FOLDER.Count

$DATETIMESTAMP = "{0:G}" -f [int][double]::Parse((Get-Date -UFormat %s))

If ($NUM -lt 5)
{
    $MSG = "[$DATETIMESTAMP] PROCESS_SERVICE_CHECK_RESULT;SERVER1;NUMFILES;0;OK: $NUM files"
}
ElseIf ($NUM -gt 8)
{
    $MSG = "[$DATETIMESTAMP] PROCESS_SERVICE_CHECK_RESULT;SERVER1;NUMFILES;2;CRITICAL: $NUM files"
}
Else
{
    $MSG = "[$DATETIMESTAMP] PROCESS_SERVICE_CHECK_RESULT;SERVER1;NUMFILES;1;WARNING: $NUM files"
}

$MSG | D:\SCRIPTS\NAGIOS\nc.exe NAGIOS_SERVER 3333
And it is done! Now we have our Nagios server configured to receive passive checks remotely and our monitored system to send the results.
To monitor it simply task-schedule the script to be executed every some minutes!