F5 BIG-IP icon   F5 BIG-IP – Useful SNMP oids to monitor


I have collected some of the most interesting OIDs (in my scenario im using LTM and APM modules) from the F5 MIBS:

OIDs – System Data

Hardware sensors (fans, power supplies…), resource usage (cpu, mem…), sync status…
MIB: F5-BIGIP-SYSTEM-MIB (file F5-BIGIP-SYSTEM-MIB.txt)

Synchronization status messagesysCmSyncStatusSummary.1.3.6.1.4.1.3375.2.1.14.1.4
Failover statussysCmFailoverStatusStatus
.1.3.6.1.4.1.3375.2.1.14.3.2
Synchronization status colorsysCmSyncStatusColor
.1.3.6.1.4.1.3375.2.1.14.1.3
Power Supply statussysChassisPowerSupplyStatus
.1.3.6.1.4.1.3375.2.1.3.2.2.2.1.2
Fan StatussysChassisFanStatus
.1.3.6.1.4.1.3375.2.1.3.2.1.2.1.2
Interface StatussysInterfaceStatus
.1.3.6.1.4.1.3375.2.1.2.4.1.2.1.17
Cpu UsagesysMultiHostCpuUsageRatio1m
.1.3.6.1.4.1.3375.2.1.7.5.2.1.27
Memory UsagesysMultiHostTable
.1.3.6.1.4.1.3375.2.1.7.4.2

OIDs – Access Policy Manager (APM)

Number of sessions in my VPN SSL portal
MIB: F5-BIGIP-APM-MIB (file F5-BIGIP-APM-MIB.txt)

Active SessionsapmPaStatCurrentActiveSessions
.1.3.6.1.4.1.3375.2.6.1.1.3.1.5
Pending SessionsapmPaStatCurrentPendingSessions
.1.3.6.1.4.1.3375.2.6.1.1.3.1.6
Completed SessionsapmPaStatCurrentCompletedSessions
.1.3.6.1.4.1.3375.2.6.1.1.3.1.7

OIDs – Local Traffic Manager (LTM)

State of my pools servers and nodes (active nodes, number of connections…)
MIB: F5-BIGIP-LOCAL-MIB (F5-BIGIP-LOCAL-MIB.txt)

Pools/Nodes namesltmPoolMemberNodeName
.1.3.6.1.4.1.3375.2.2.5.3.2.1.19
Nodes Current ConnectionsltmNodeAddrStatServerCurConns
.1.3.6.1.4.1.3375.2.2.4.2.3.1.9
Nodes StatusltmPoolMemberMonitorStatus
.1.3.6.1.4.1.3375.2.2.5.3.2.1.11

Downloading MIB files

You can download the MIB files using the WEB gui (About -> Download section -> MIB files)
F5 BIG-IP – Useful SNMP oids to monitor - Download MIB file
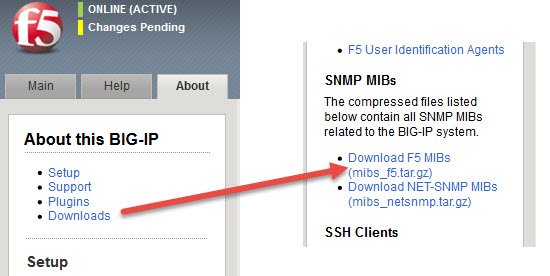
For more information… https://support.f5.com/csp/article/K13322

Output examples

These are the snmpwalk command outputs for some of these OIDs:

# snmpwalk -v2c -c public bigip1 F5-BIGIP-SYSTEM-MIB::sysCmFailoverStatusStatus
F5-BIGIP-SYSTEM-MIB::sysCmFailoverStatusStatus.0 = STRING: ACTIVE
# snmpwalk -v2c -c public bigip2 .1.3.6.1.4.1.3375.2.1.14.3.2
F5-BIGIP-SYSTEM-MIB::sysCmFailoverStatusStatus.0 = STRING: STANDBY

Note you can use either MIB name or OID format

# snmpwalk -v2c -c public bigip1 F5-BIGIP-SYSTEM-MIB::sysChassisPowerSupplyTable
F5-BIGIP-SYSTEM-MIB::sysChassisPowerSupplyIndex.1 = INTEGER: 1
F5-BIGIP-SYSTEM-MIB::sysChassisPowerSupplyIndex.2 = INTEGER: 2
F5-BIGIP-SYSTEM-MIB::sysChassisPowerSupplyStatus.1 = INTEGER: good(1)
F5-BIGIP-SYSTEM-MIB::sysChassisPowerSupplyStatus.2 = INTEGER: good(1)


# snmpwalk -v2c -c public bigip1 F5-BIGIP-LOCAL-MIB::ltmNodeAddrStatServerCurConns
F5-BIGIP-LOCAL-MIB::ltmNodeAddrStatServerCurConns."/LAN/EXCHANGE01" = Gauge32: 3341
F5-BIGIP-LOCAL-MIB::ltmNodeAddrStatServerCurConns."/LAN/EXCHANGE02" = Gauge32: 3383
F5-BIGIP-LOCAL-MIB::ltmNodeAddrStatServerCurConns."/LAN/PROXY01" = Gauge32: 2853
F5-BIGIP-LOCAL-MIB::ltmNodeAddrStatServerCurConns."/LAN/PROXY02" = Gauge32: 2631

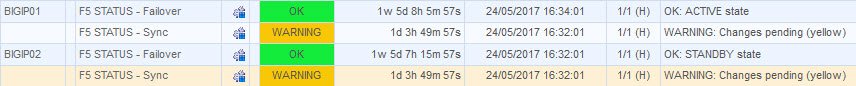
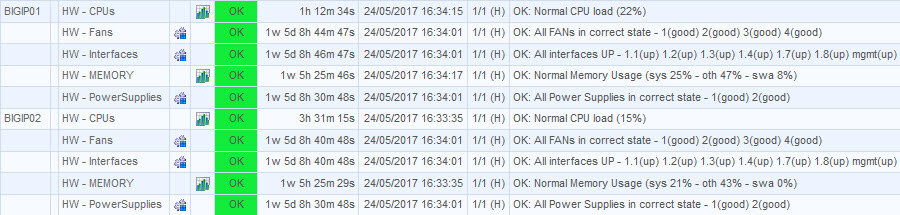
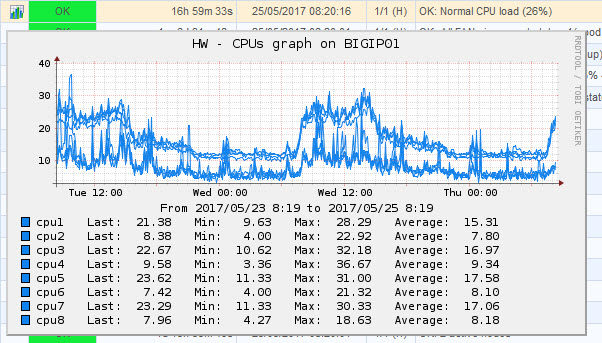
Examples of Nagios monitoring F5 using SNMP

(i have been working on my own nagios plugins to parse the SNMP output and customize the sensors in Nagios)

Sync status
F5 BIG-IP – Useful SNMP oids to monitor - Download MIB file

HW status
F5 BIG-IP – Useful SNMP oids to monitor - Nagios HW

CPU graphs
F5 BIG-IP – Useful SNMP oids to monitor - Nagios CPU

Pool and nodes connections
F5 BIG-IP - Useful SNMP oids to monitor - Pool connections

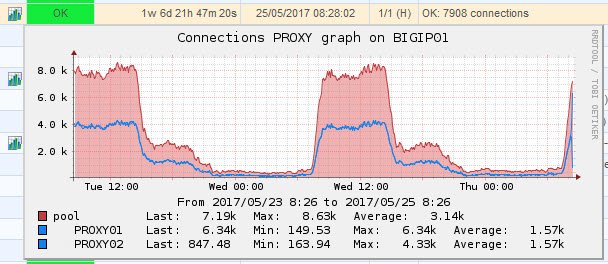
Pool and nodes state
F5 BIG-IP – Useful SNMP oids to monitor - Pool nodes states

15 thoughts on “F5 BIG-IP – Useful SNMP oids to monitor

    • For example:
      # /usr/bin/snmpwalk -v2c -c public bigip01 F5-BIGIP-SYSTEM-MIB::sysInterfaceStatus
      F5-BIGIP-SYSTEM-MIB::sysInterfaceStatus.”1.1″ = INTEGER: up(0)
      F5-BIGIP-SYSTEM-MIB::sysInterfaceStatus.”1.2″ = INTEGER: up(0)
      F5-BIGIP-SYSTEM-MIB::sysInterfaceStatus.”1.3″ = INTEGER: up(0)
      F5-BIGIP-SYSTEM-MIB::sysInterfaceStatus.”1.4″ = INTEGER: up(0)
      F5-BIGIP-SYSTEM-MIB::sysInterfaceStatus.”1.5″ = INTEGER: down(1)
      F5-BIGIP-SYSTEM-MIB::sysInterfaceStatus.”1.6″ = INTEGER: down(1)
      F5-BIGIP-SYSTEM-MIB::sysInterfaceStatus.”1.7″ = INTEGER: up(0)
      F5-BIGIP-SYSTEM-MIB::sysInterfaceStatus.”1.8″ = INTEGER: up(0)
      F5-BIGIP-SYSTEM-MIB::sysInterfaceStatus.”2.1″ = INTEGER: unpopulated(5)
      F5-BIGIP-SYSTEM-MIB::sysInterfaceStatus.”2.2″ = INTEGER: unpopulated(5)
      F5-BIGIP-SYSTEM-MIB::sysInterfaceStatus.”mgmt” = INTEGER: up(0)

      I dont know if you refer to the example i show about my nagios environment (now i have migrated to Icinga). But that involves much more work to explain it in a simple comment.

      • Dear Sir, may I ask you.
        To check F5 interface status, which plugin shall I use?
        OR
        How to write shell script to get as in above PHOTO?
        Please kindly reply sir ^_^

  1. Can you share your nagios plugins with me? I couldn´t find on your website. If you could share I will thank you, I don´t know how to create plugins, so if you could help me.

  2. Hello,
    Is it possible to make an SNMP request only on a pool member (example pool_member_A).

    The following command does not work (snmpwalk -v2c -c public 127.0.0.1 F5-BIGIP-LOCAL-MIB::ltmPoolStatCurSessions.”/Common/pool_member_A”)

    I don’t want to list the outcome of all pools.

    Thanks.

    • I use by node like in the example:
      snmpwalk -v2c -c public bigip1 F5-BIGIP-LOCAL-MIB::ltmNodeAddrStatServerCurConns

      Then you can parse, grep or whatever you want by the concrete node you want the data of.

  3. Helo,

    F5 CPU Usage is categorized by data plane CPU, control plane CPU dan analisys plane CPU.

    How do you monitor CPU Usage based on this categorize ?

  4. Hi
    How can I monitor specific virtual server statistics, such as number of current connections, by SNMP? I have several virtual servers, I need to monitor number of each specific virtual server separatly.

  5. Hi,

    F5 CPU Usage is categorized by data plane CPU, control plane CPU dan analisys plane CPU.

    Can you share all for me

    How do you monitor CPU Usage based on this categorize ?

Leave a Reply

Your email address will not be published. Required fields are marked *