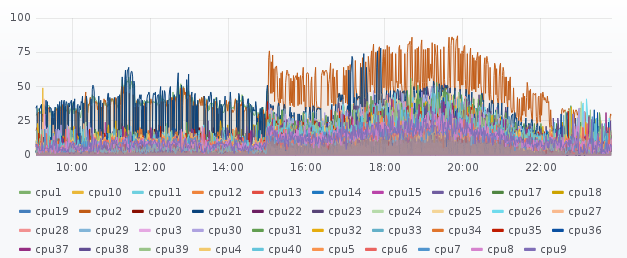
Last monday I realized that the cpu was very high on one of my Checkpoint VSX nodes.
Looking at my Icinga graphs it seemed it started on friday at 3 o’clock:
Running a top directly on the VSX, I delimited the high to one of the virtual systems that runs on that VSX. In this image the fwk2 threads that are associated to VS2 can be seen with very high %CPU (to show threads using top command, press Shift+H).
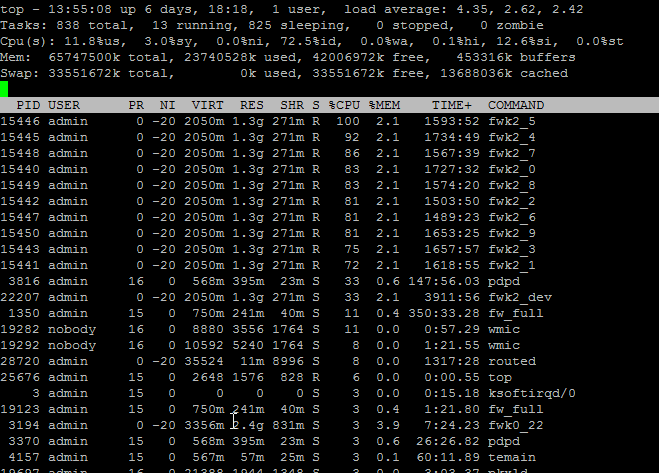
The problem was that SecureXL was disabled in that virtual system.
[Expert@vsx2:2]# fwaccel stat
Accelerator Status : off

Accelerator Features : Accounting, NAT, Cryptography, Routing,
                       HasClock, Templates, Synchronous, IdleDetection,
                       Sequencing, TcpStateDetect, AutoExpire,
                       DelayedNotif, TcpStateDetectV2, CPLS, McastRouting,
                       WireMode, DropTemplates, NatTemplates,
                       Streaming, MultiFW, AntiSpoofing, Nac,
                       ViolationStats, AsychronicNotif, ERDOS,
                       McastRoutingV2, NMR, NMT, NAT64, GTPAcceleration,
                       SCTPAcceleration
Cryptography Features Mask : not available
It was my mistake! I disabled SecureXL to run some tcpdumps (otherwise some packets might not be shown) and forgot to reenable it.
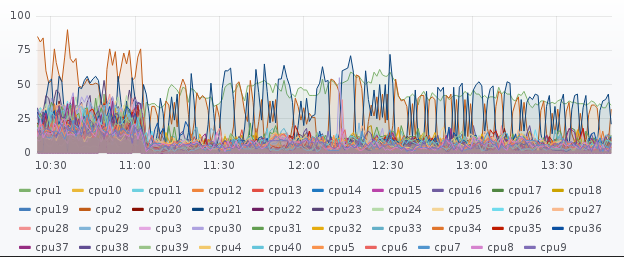
After reenabling SecureXL…
[Expert@vsx2:2]# fwaccel on… cpu usage dropped significantly
top - 14:47:48 up 6 days, 19:11,  1 user,  load average: 1.79, 2.18, 2.79
Tasks: 838 total,   2 running, 836 sleeping,   0 stopped,   0 zombie
Cpu(s):  4.0%us,  2.9%sy,  0.0%ni, 91.1%id,  0.0%wa,  0.1%hi,  1.9%si,  0.0%st
Mem:  65747500k total, 23843544k used, 41903956k free,   456348k buffers
Swap: 33551672k total,        0k used, 33551672k free, 13702588k cached

  PID USER      PR  NI  VIRT  RES  SHR S %CPU %MEM    TIME+  COMMAND
22207 admin      0 -20 2067m 1.3g 260m R   35  2.1   3929:58 fwk2_dev
15448 admin      0 -20 2067m 1.3g 260m S   29  2.1   1583:07 fwk2_7
 1764 admin      0 -20 3356m 2.4g 826m S   28  3.8 267:08.90 fwk0_dev
15445 admin      0 -20 2067m 1.3g 260m S   17  2.1   1753:14 fwk2_4
15450 admin      0 -20 2067m 1.3g 260m S   15  2.1   1669:34 fwk2_9
15440 admin      0 -20 2067m 1.3g 260m S   14  2.1   1743:35 fwk2_0
15442 admin      0 -20 2067m 1.3g 260m S   14  2.1   1521:13 fwk2_2
15443 admin      0 -20 2067m 1.3g 260m S   13  2.1   1674:35 fwk2_3
15441 admin      0 -20 2067m 1.3g 260m S   11  2.1   1634:25 fwk2_1
15446 admin      0 -20 2067m 1.3g 260m S   10  2.1   1610:28 fwk2_5
28720 admin      0 -20 35524  11m 8996 S   10  0.0   1322:49 routed
15447 admin      0 -20 2067m 1.3g 260m S    8  2.1   1503:54 fwk2_6
15449 admin      0 -20 2067m 1.3g 260m S    8  2.1   1589:41 fwk2_8
 1350 admin     15   0  750m 241m  40m S    7  0.4 354:26.46 fw_full
22792 admin      0 -20  714m  91m  47m S    7  0.1 236:04.39 fwk6_0
13314 admin     15   0  301m  72m  44m S    5  0.1  54:54.02 cpd
 3816 admin     16   0  569m 395m  23m S    3  0.6 149:23.29 pdpd
 7141 admin     15   0  750m 241m  40m S    2  0.4   0:00.61 fw_full
 7440 nobody    16   0 10076 4680 1764 S    2  0.0   0:00.38 wmic
10961 admin      0 -20 1411m 762m 205m S    2  1.2  17:51.33 fwk1_4
   54 admin     15   0     0    0    0 S    1  0.0   0:00.01 ksoftirqd/17
 7140 admin     15   0  750m 241m  40m S    1  0.4   0:00.45 fw_full