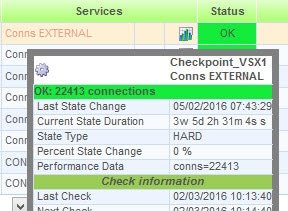
Having our Checkpoint VSX Virtual System active connections under control can be very important to avoid problems, configure a higher connection limit, be ready for growth (and so scalate our environment)…
Nagios and SNMP can be used to configure a VS connection monitor plugin:
Steps needed to configure the plugin:
- SNMP OID for virtual systems active connections
- Develop an script to be used as a Nagios plugin
- Configure Nagios to use a new check command
- Configure Nagios service using the new check command
SNMP OID/MIB for virtual systems active connections
We can use either the OID (.1.3.6.1.4.1.2620.1.16.23.1.1.2) or the MIB object name (vsxCountersConnNum). To download the MIB, this link: sk90470
# /usr/bin/snmpwalk -v1 -c public vsx1 .1.3.6.1.4.1.2620.1.16.23.1.1.2
# /usr/bin/snmpwalk -v1 -c public vsx1 vsxCountersConnNum
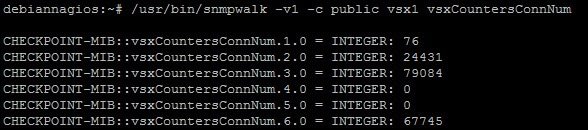
This OID/Object shows the active connections for the physical VSX (vsxCountersConnNum.1.0) and for each virtual system (f.e. vsxCountersConnNum.2.0 for VS1, …)
Very important! If the queries are unexpectedly returned with value 0, look at this post:
Checkpoint – SNMP return 0 value when querying virtual systems
This snmpwalk command is the main element of our plugin script.
Develop an script to be used as a Nagios plugin
This is the check_fw_vs_connections.sh script (download it here):
HOST=$1
VS=$2
LIMIT=$3
LIMIT2=$4

SNMP=`/usr/bin/snmpwalk -v1 -c public $HOST vsxCountersConnNum.$VS 2> /dev/null`

if [ $? -ne 0 ]
then
        echo "UNKNOWN: No SNMP response from $HOST"
        exit 3
fi

RESULT=`echo $SNMP | awk '{ print $4 }' 2> /dev/null`

if [ $RESULT -gt $LIMIT2 ]
then
        echo "CRITICAL: More than $LIMIT2 connections ($RESULT)|conns=$RESULT"
        exit 2
fi

if [ $RESULT -gt $LIMIT ]
then
       echo "WARNING: More than $LIMIT connections ($RESULT)|conns=$RESULT"
       exit 1
fi

echo "OK: $RESULT connections|conns=$RESULT"
exit 0
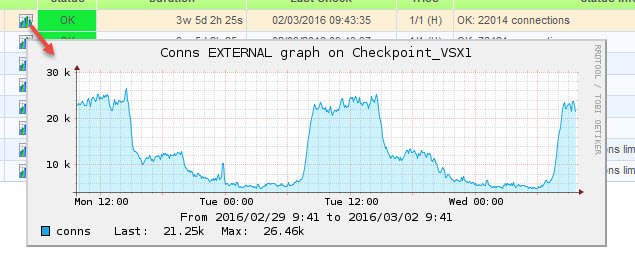
The script receives the host, the virtual system, warning and critical number of connections and returns exit code as Nagios expects, and the output shows a message and sends performance data (to generate the graphs).
To be available for Nagios, in my Centreon the plugin must be copied to /usr/lib/nagios/plugins.
Dont forget to chmod +x the file to give execution permissions.
debiannagios:~# /usr/lib/nagios/plugins/check_fw_vs_connections.sh vsx1 3.0 1000 500
CRITICAL: More than 500 connections (80059)|conns=80059
Configure Nagios to use a new check command
After creating the script and copying it to the nagios plugins folder, the new check command can be configured.
Section Configuration / Commands / Checks section
For Centreon:
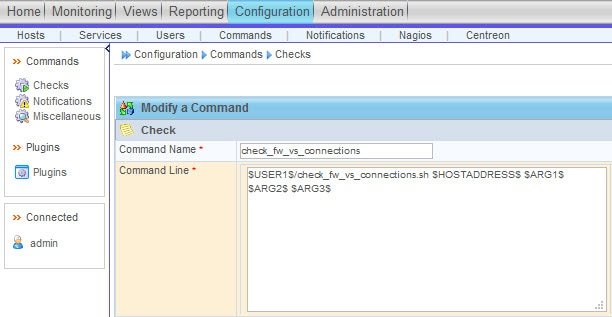
Assign a name and configure this command line (parameters of the script, the first one is assigned by Nagios using the host value):
$USER1$/check_fw_vs_connections.sh $HOSTADDRESS$ $ARG1$ $ARG2$ $ARG3$For standard Nagios (checkcommands.cfg):
define command{
        command_name                    check_fw_vs_connections
        command_line                    $USER1$/check_fw_vs_connections.sh $HOSTADDRESS$ $ARG1$ $ARG2$ $ARG3$
}
Configure Nagios service using the new check command
Centreon:
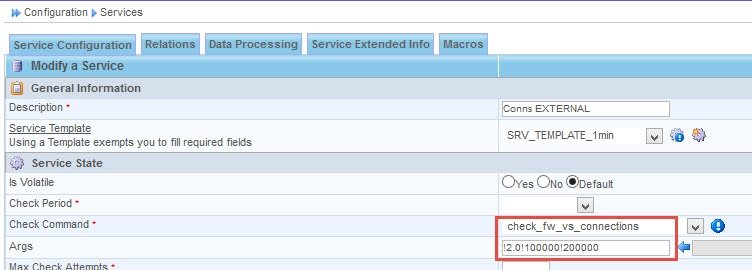
Check Command: The value should be the name assigned to the command (check_fw_vs_connections)
Args: Will contain 3 parameters, starting and separated with the character '!'
- Param 1: VS (remember 1.0 is the VSX itself, 2.0 is the VS1…)
- Param 2: Warning connections limit
- Param 3: Critical connections number
For standard Nagios (services.cfg):
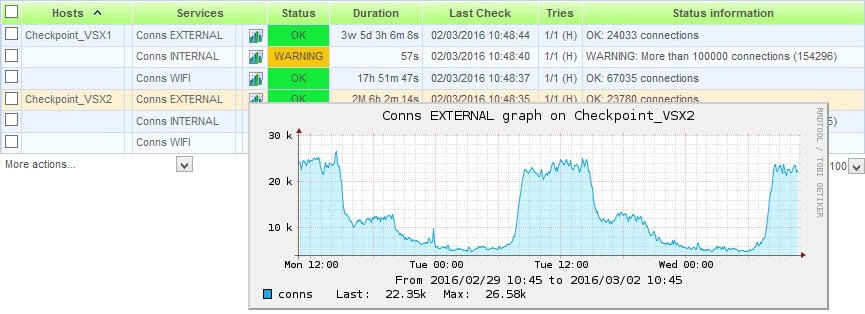
define service{
        host_name                       Checkpoint_VSX1, Checkpoint_VSX2
        service_description             Conns EXTERNAL
        _SERVICE_ID                     202
        use                             SRV_TEMPLATE_1min
        check_command                   check_fw_vs_connections!2.0!100000!200000
}
This example… !2.0!100000!200000 is for Virtual System 1, when connections are under 100000 the state is OK, between 100000 and 200000 is WARNING and more then 200000 is critical.
After restarting Nagios services, the connections should be monitorized and the graphs being generated within some minutes