When suffering random network interruptions, a possible cause (and difficult to find) is our firewall ARP table overflow. In Checkpoint systems, the Linux kernel Gaia is based on would log messages like "kernel: neighbour table overflow" to /var/log/messages.
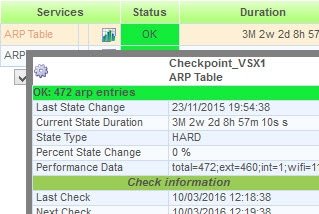
After living two small crisis due to this problem (network scanning software and mask B networks are dangerous for the firewall ARP table), to detect it as soon as possible and proactively I configured to Nagios to monitor the status of the ARP table.
Steps needed to configure the plugin
- Command to get remotely ARP table entries number
- Develop an script to be used as a Nagios plugin
- Configure Nagios to use a new check command
- Configure Nagios service using the new check command
Command to get remotely ARP table entries number
In this scenario, the Checkpoint is a VSX with 3 virtual firewalls. So, it is neccesary to obtain the number of ARP entries of each virtual system. Inside the Checkpoint system this script returns as output the number of ARP entries of the virtual systems and the total sum.
This is the arptable.sh (download it here):
#!/bin/bash

. /etc/profile.d/vsenv.sh

vsenv 1 > /dev/null
ARP1=`arp -n -a | wc -l`
vsenv 2 > /dev/null
ARP2=`arp -n -a | wc -l`
vsenv 5 > /dev/null
ARP3=`arp -n -a | wc -l`

ARPTOTAL=`expr $ARP1 + $ARP2 + $ARP3`

echo "$ARP1"
echo "$ARP2"
echo "$ARP3"
echo "$ARPTOTAL"
After "chmod +x" it, this is an example execution:
[Expert@vsx1:0]# /home/admin/SCRIPTS/arptable.sh
471
1
12
484
Now, to configure the Nagios system to execute SSH commands remotely on the Checkpoint device see the post "Linux: SSH connection without password (RSA public-key)"
This is an example remote execution:
nagios@debiannagios:~$ ssh -l admin vsx1 "/home/admin/SCRIPTS/arptable.sh" 2> /dev/null
468
1
12
481
Logically, for this example the script should been placed on the /home/admin/SCRIPTS folder.
Develop an script to be used as a Nagios plugin
This is the check_fw_arptable_vsx.sh (download it here):
HOST=$1
WARNING=$2
CRITICAL=$3

ping -c 1 $HOST &> /dev/null
if [ $? -ne 0 ]
then
        echo "UNKNOWN: No response from $HOST"
        exit 3
fi

RESULT=`ssh -l admin $HOST "/home/admin/SCRIPTS/arptable.sh" 2> /dev/null`

ARP1=`echo $RESULT | cut -d" " -f1`
ARP2=`echo $RESULT | cut -d" " -f2`
ARP3=`echo $RESULT | cut -d" " -f3`
ARPTOTAL=`echo $RESULT | cut -d" " -f4`

if [ $ARPTOTAL -gt $CRITICAL ]
then
        echo "CRITICAL: $ARPTOTAL arp entries|total=$ARPTOTAL;ext=$ARP1;int=$ARP2;wifi=$ARP3;"
        exit 2
elif [ $ARPTOTAL -gt $WARNING ]
then
        echo "WARNING: $ARPTOTAL arp entries|total=$ARPTOTAL;ext=$ARP1;int=$ARP2;wifi=$ARP3;"
        exit 1
else
        echo "OK: $ARPTOTAL arp entries|total=$ARPTOTAL;ext=$ARP1;int=$ARP2;wifi=$ARP3;"
        exit 0
fi
The script receives the host, warning and critical number of connections and returns exit code as Nagios expects, and the output shows a message and sends performance data.
To be available for Nagios, in my Centreon the plugin must be copied to /usr/lib/nagios/plugins.
Dont forget to chmod +x the file to give execution permissions.
nagios@debiannagios:~$ /usr/lib/nagios/plugins/check_fw_arptable_vsx.sh vsx1 1000 500OK: 479 arp entries|total=479;ext=468;int=1;wifi=10;
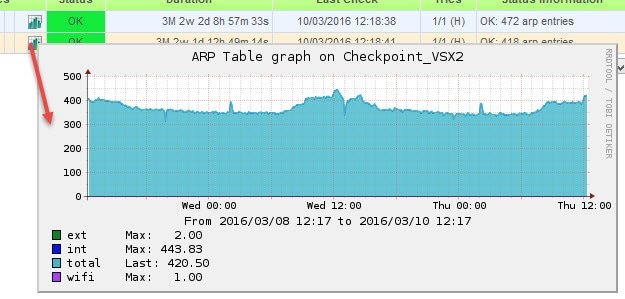
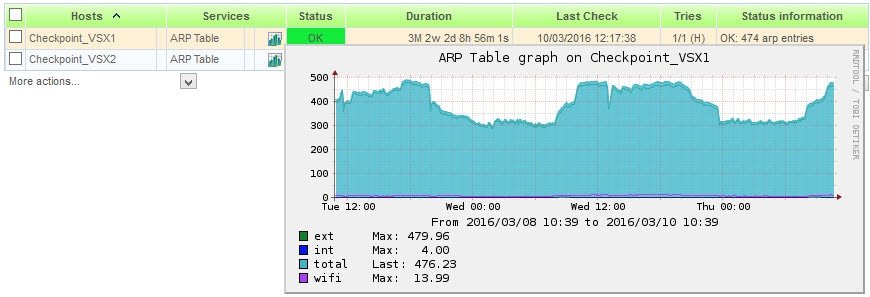
The performance data IDs can be changed. In this scenario the IDs are total, ext, int and wifi for total sum, external, internal and wifi virtual firewalls).
Configure Nagios to use a new check command
After creating the script and copying it to the nagios plugins folder, the new check command can be configured.
Section Configuration / Commands / Checks section
For Centreon:
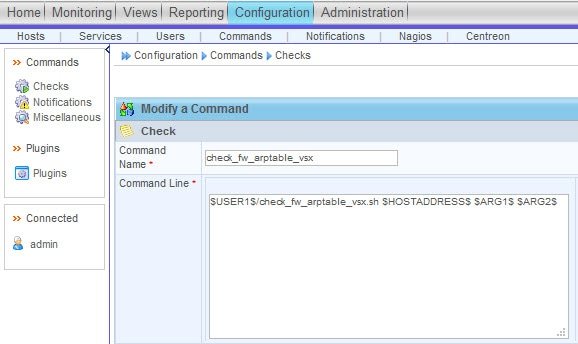
Assign a name and configure this command line (parameters of the script, the first one is assigned by Nagios using the host value):
$USER1$/check_fw_arptable_vsx.sh $HOSTADDRESS$ $ARG1$ $ARG2$
For standard Nagios (checkcommands.cfg):
define command{
        command_name                    check_fw_arptable_vsx
        command_line                    $USER1$/check_fw_arptable_vsx.sh $HOSTADDRESS$ $ARG1$ $ARG2$
}
Configure Nagios service using the new check command
Centreon:
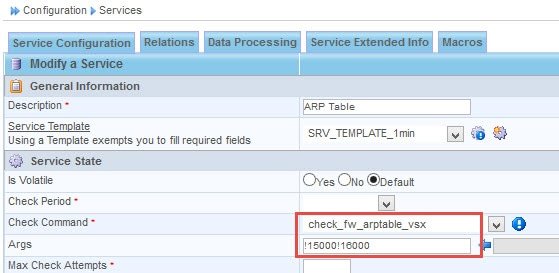
Check Command: The value should be the name assigned to the command (check_fw_arptable_vsx)
Args: Will contain 3 parameters, starting and separated with the character '!'
- Param 1: Warning connections limit
- Param 2: Critical connections number
For standard Nagios (services.cfg):
define service{
        host_name                       Checkpoint_VSX1, Checkpoint_VSX2
        service_description             ARP Table
        _SERVICE_ID                     188
        use                             SRV_TEMPLATE_1min
        check_command                   check_fw_arptable_vsx!15000!16000
}
In this example, when ARP table entries are under 15000 the state is OK, between 15000 and 16000 is WARNING and more then 16000 is critical.
After restarting Nagios services, the connections should be monitorized and the graphs being generated within some minutes